GEMMER
- Complements the existing web-based databases and visualization tools for budding yeast
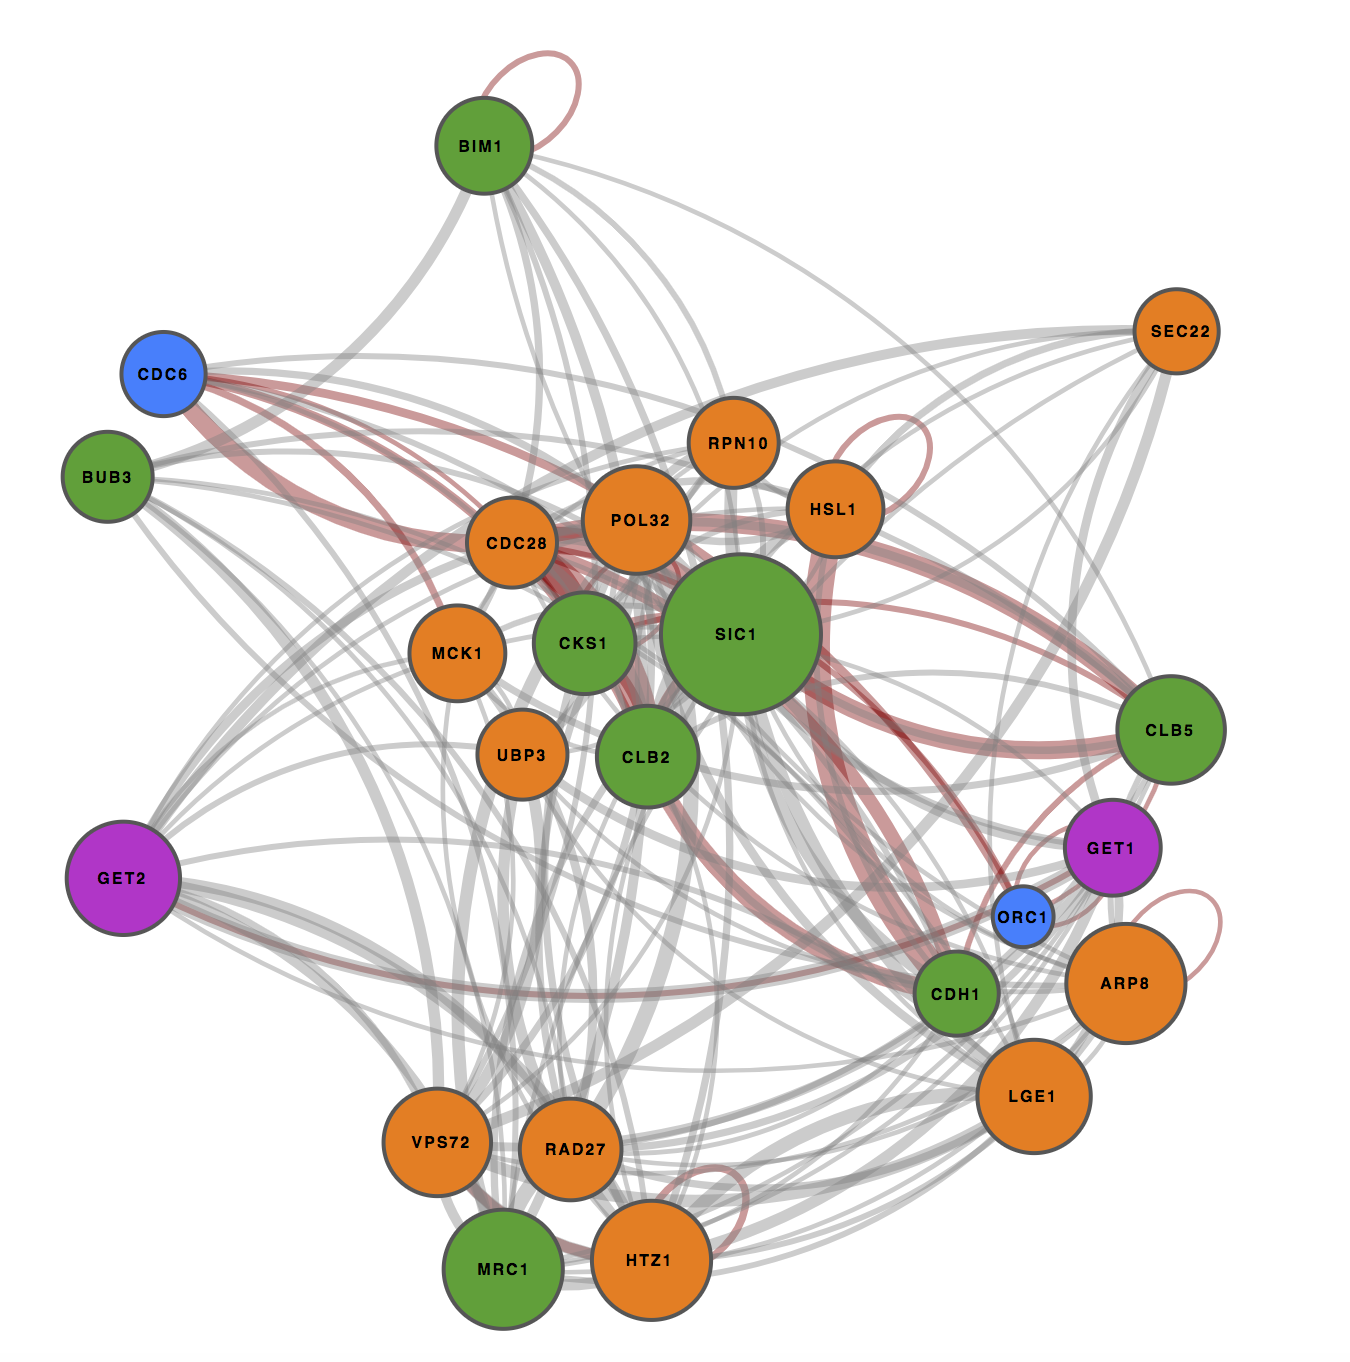
- Provides high-quality visualizations of interaction networks for user-specified gene(s)
- Highlights within such visualizations information on function, expression, timing and network importance
- Goes beyond "hairball" networks to provide rational visualizations
Data integration
GEMMER integrates data from various sources into a single database
- SGD Interactome and experimental evidence
- CYCLoPs Relative abundance and localization
- YeastGFP Absolute abundance and localization
- SCEPTRANS Timing of peak transcription during the cell cycle
- Yeast 7.6 List of metabolic enzymes


Data export and modeling
Visualized interactomes may be exported in a variety of formats for further analysisExport network to Excel, JSON, GraphML
For offline usage and further analysis by Gephi and Cytoscape